 ™
October 11–November 10, 2026 · A rolling 30-day retrieval report

Report summary
Known AI-crawler identities accounted for 53.8% of successful external retrieval requests in StreetProof's latest 30-day reporting window. Evidence endpoints received the largest share of traffic. Calgary led the recorded city tags, followed by Sydney and Winnipeg.
What did machines retrieve from StreetProof this month?
Crawlers belong in this report. StreetProof makes physical business observations available as structured records, so a machine retrieving those records is part of the intended use. Human website visits answer a different question.
The useful question is what was retrieved, and how much the request tells us about what happened next.
Evidence received more requests than company profiles
Evidence endpoints accounted for 56.1% of successful external requests. Company-profile endpoints accounted for another 35.8%. Together, those routes represented 92.0% of the total.
The leading requested company names were concentrated in delivery, freight, shipping, fleet rental and large consumer brands. These are subjects of the requested records, not identified customers or organizations making the requests. We keep the named company-demand breakdown private.
A business description tells a reader what a company says about itself. A dated physical observation adds something different: a record of visible branding that can be inspected alongside that description. The request mix shows that evidence records were being fetched. It does not tell us whether every caller read, trusted or used the returned material.
Which cities appeared in requests?
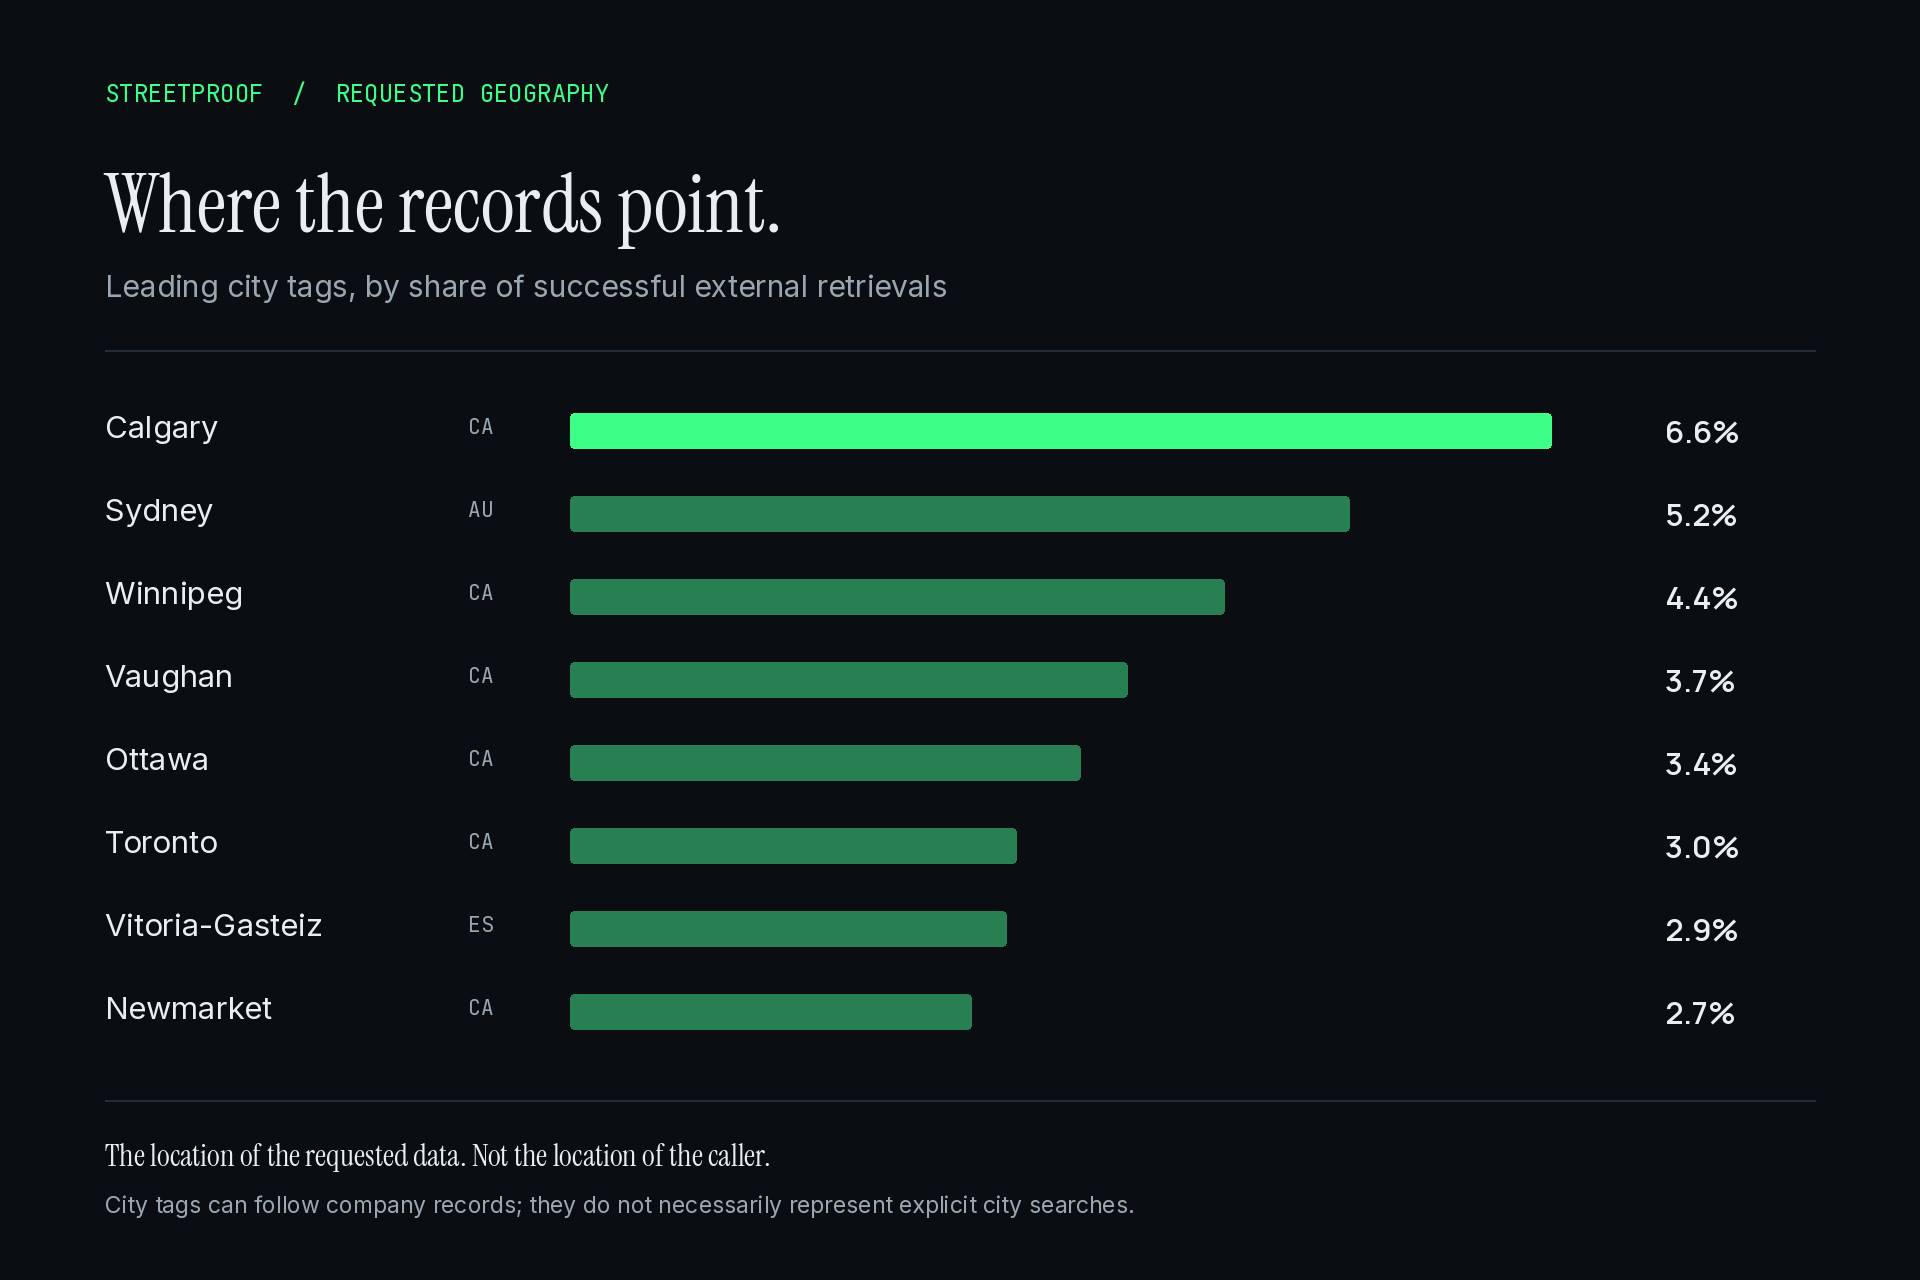
Calgary accounted for 6.6% of successful external requests, Sydney 5.2%, and Winnipeg 4.4%. Vaughan followed at 3.7%, Ottawa at 3.4%, and Toronto at 3.0%. Gasteiz / Vitoria, Newmarket, Dubuque and Vancouver rounded out the leading city tags.
Canadian city tags accounted for 43.7% of all successful requests. US city tags represented 25.4%, Australia 12.7%, Finland 10.8%, and Spain 4.9%.
These are locations attached to requested records or queries, not the locations of the callers. A request tagged Calgary does not necessarily mean someone searched for Calgary: a caller may have fetched a company record already associated with the city. The rankings also reflect the available catalogue and crawl patterns; they are not a measure of local consumer demand.
Which machine identities appeared?
Traffic carrying known AI-crawler user agents contributed 53.80% of successful external requests. Unattributed automation contributed 28.16%, browser-family API clients 17.80%, and MCP tool calls 0.24%.
Within the identified crawler segment, 94.7% of successful requests carried the Claude-SearchBot identity and 4.9% carried PerplexityBot. Meta-ExternalAgent, OAI-SearchBot and ChatGPT-User also appeared.
These labels come from user-agent matching. They are not independently authenticated provider identities. Browser-family traffic remains separate, and we do not assign anonymous requests to an AI company. MCP is included in the total, but it was a small share of this window's activity.
A large crawl shaped the month
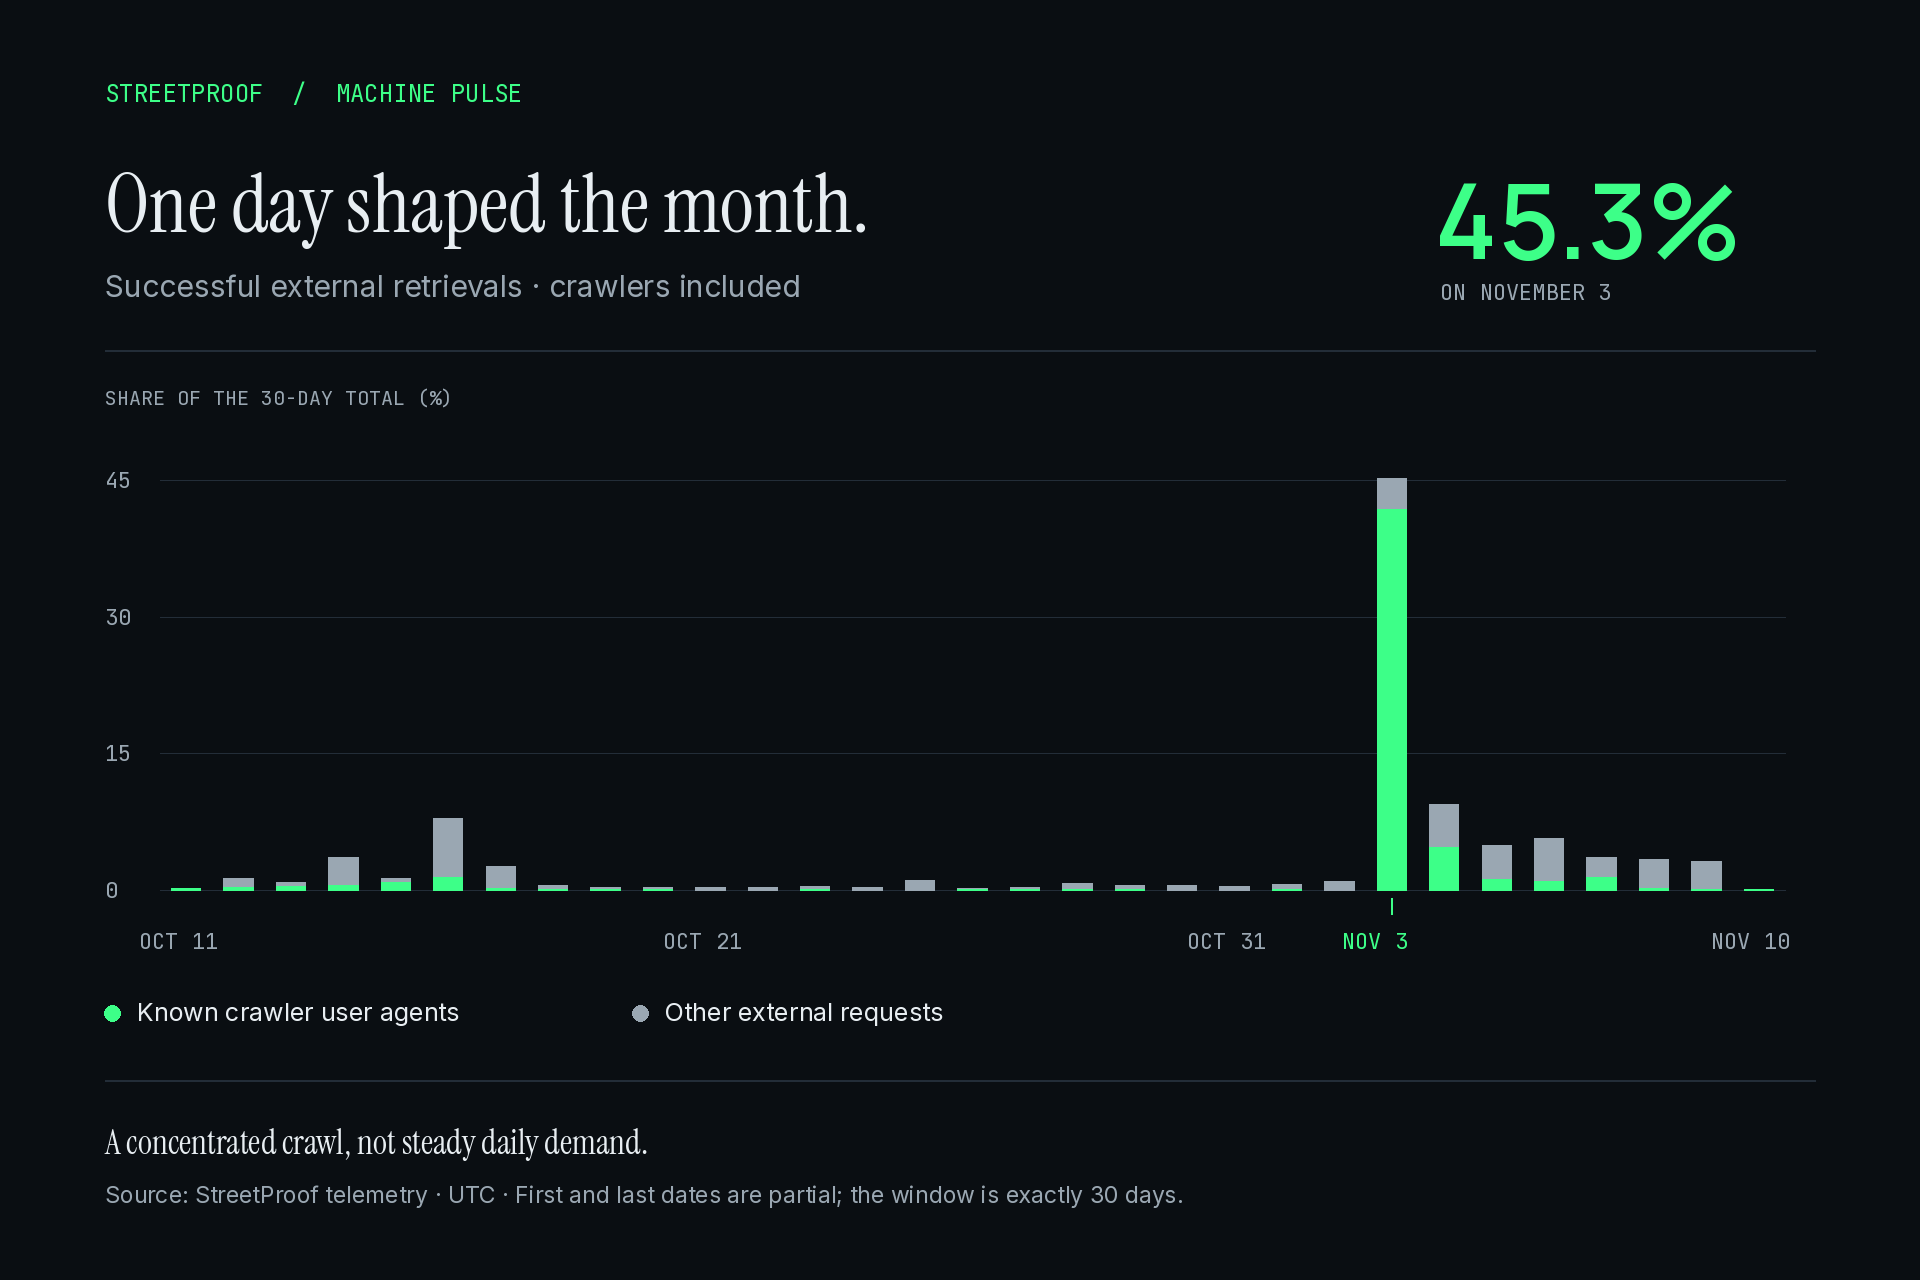
45.3% of the window's successful requests arrived on November 3 UTC. Most of that day's volume carried the Claude-SearchBot identity. This was a concentrated burst, not a steady daily rate.
Against the preceding equal-length window, successful requests carrying known crawler identities increased 34.6%. Total successful external requests decreased 27.7%. Both belong in the update: the crawler segment grew while overall request volume fell. The comparison describes logged activity, not a proven change in market demand.
Of all recorded external attempts, 99.96% returned an HTTP 2xx response. That is a request-success measure, not an accuracy score for the evidence or a measure of uptime.
What this means for a business's physical record
A crawler request is a useful sign that a record is reachable. It is not proof that an AI assistant recommended the business, cited StreetProof in an answer or used the record to make a decision.
That distinction keeps the next step clear. StreetProof needs to make each returned observation useful enough to inspect: what was observed, when it was observed, its source and its limits. A branded vehicle can document mobile presence; it cannot establish a permanent office or prove service quality.
If you are evaluating StreetProof as a source, start with physical citations, then read the methodology. Follow the evidence behind a company record. That is a better test than treating a crawl count as an endorsement.
Inspect the source
Read the live index for yourself.
The report freezes one aggregate snapshot. The public index remains the source of record for accepted observations and current coverage.
Explore the StreetProof public index